
Ethereum's Layer 2 solutions promise massive scalability, but the data availability battle decides if they deliver. Traditional L1 DA clings to the mainnet like a security blanket, while modular DA layers offload the heavy lifting to specialized chains. This comparison dives into why Ethereum rollups DA is shifting, pitting L1 vs modular DA head-on for blockchain scalability DA supremacy.
Unpacking Traditional L1 Data Availability Constraints
Picture Ethereum's base layer as a bustling highway jammed with transaction data. Traditional L1 DA requires rollups to post all their transaction calldata directly to the mainnet. This ensures every node can verify data availability, inheriting Ethereum's battle-tested security. But here's the rub: as L2 activity surges, calldata bloats blocks, spiking fees and throttling throughput.
Proto-danksharding (EIP-4844) tried to ease this with blobs, yet Ethereum still caps at around 15-30 TPS effectively for L2s under L1 DA. Congestion hits hard during peaks, like DeFi frenzies or NFT mints. Rollups like Optimism and Arbitrum post compressed data, but they're tethered to L1's economics. Security? Unmatched. Cost-efficiency? Laughable at scale.
This setup worked for early L2s responding to high L1 gas fees, but it created data availability dilemmas. Nodes must download gigabytes, light clients struggle, and centralization risks creep in as fewer full nodes cope.
The Modular DA Revolution Unleashed
Enter modular DA layers: Celestia, Avail, and EigenDA flip the script by decoupling data posting from execution and settlement. These specialized chains handle DA off Ethereum, slashing costs by 90-99% while enabling thousands of TPS per rollup.
Celestia's Data Availability Sampling (DAS) is a game-changer. Light nodes sample tiny data chunks to confirm availability probabilistically, no full downloads needed. This boosts decentralization; anyone verifies with minimal resources. Avail adds KZG commitments for succinct proofs, perfect for Ethereum rollups DA integration.
Modular setups let L2s settle on Ethereum for security but store data elsewhere. Throughput explodes: a single DA layer supports multiple rollups in parallel. Zeeve notes DA layers store transaction details, smart contracts, and off-chain data for L1, L2, L3 nodes seamlessly. It's the modular blockchain thesis in action, separating concerns for hyper-efficiency.
Ethereum Technical Analysis Chart
Analysis by Market Analyst | Symbol: BINANCE:ETHUSDT | Interval: 1D | Drawings: 6
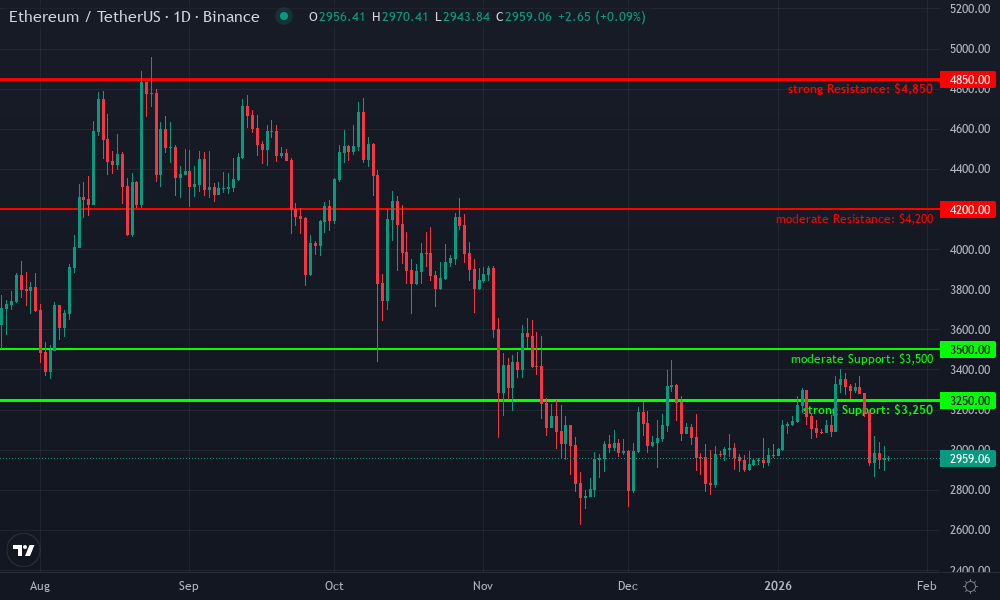
Technical Analysis Summary
As a seasoned technical analyst with 5 years of experience focusing on pure price action and key indicators, my drawing instructions for this ETHUSDT chart emphasize clarity and precision. Start by drawing a prominent downtrend line connecting the September 2026 high at ~4850 to the December 2026 low at ~3250, using 'trend_line' tool in red. Add an emerging short-term uptrend line from the December low to the late January 2026 bounce at ~3950, in green. Mark horizontal support at 3200-3250 (strong, thick blue line) and resistance at 4200 (moderate, orange) and 4800 (strong, red). Use 'rectangle' for the ongoing consolidation zone from mid-December 2026 to present around 3500-4000. Place 'arrow_mark_down' on declining volume during the downtrend and 'arrow_mark_up' on recent volume spike. Add 'fib_retracement' from the major high to low for potential retracement levels at 38.2% (~3800) and 50% (~4050). Finally, 'callout' texts for entry zones near support with medium risk.
Risk Assessment: medium
Analysis: Choppy consolidation after downtrend with bearish MACD, but support holding and volume improving; DA scalability narrative supportive long-term
Market Analyst's Recommendation: Consider longs near 3350 with stops below 3200, target 4200+; monitor for breakout confirmation
Key Support & Resistance Levels
📈 Support Levels:
- $3,250 - Strong December capitulation low, high volume support strong
- $3,500 - Mid-Jan consolidation base moderate
📉 Resistance Levels:
- $4,200 - Recent swing high, key breakout level moderate
- $4,850 - September 2026 major high strong
Trading Zones (medium risk tolerance)
🎯 Entry Zones:
- $3,350 - Bounce from strong support with volume confirmation, aligns with medium risk tolerance medium risk
- $3,800 - Fib 38.2% retracement pullback entry if uptrend holds low risk
🚪 Exit Zones:
- $4,200 - Initial profit target at resistance 💰 profit target
- $4,500 - Extended target on breakout 💰 profit target
- $3,100 - Stop loss below major support 🛡️ stop loss
Technical Indicators Analysis
📊 Volume Analysis:
Pattern: decreasing on downtrend, spiking on recent bounce
Volume dried up during decline (bearish exhaustion), recent spike supports reversal
📈 MACD Analysis:
Signal: bearish crossover persisting
MACD line below signal, histogram contracting but negative - caution for bulls
Applied TradingView Drawing Utilities
This chart analysis utilizes the following professional drawing tools:
Disclaimer: This technical analysis by Market Analyst is for educational purposes only and should not be considered as financial advice. Trading involves risk, and you should always do your own research before making investment decisions. Past performance does not guarantee future results. The analysis reflects the author's personal methodology and risk tolerance (medium).
Scalability Metrics: L1 vs Modular DA Face-Off
Let's crunch numbers. Traditional L1 DA limits L2s to Ethereum's 1-2 MB blocks post-Dencun, translating to 100-200 KB per rollup per block. Modular DA? Celestia blobs 1 GB and per block, shared across rollups. Result: L1 DA rollups hit 2,000 TPS max; modular ones scale to 10,000 and TPS combined.
Costs tell the tale too. Posting 1 MB calldata on Ethereum? $50-500 during peaks. On Celestia? Pennies. This unlocks data availability L2 viability for high-volume apps like gaming or socialfi.
Diving deeper, DAS democratizes verification. Hackernoon highlights how rollups leaned on Ethereum DA initially, but modular paths like Celestia evolve that. For Ethereum L2s, this means parallel execution, cheaper states, and true mass adoption potential. Check how DA layers power modular rollups for Ethereum scaling insights.
Real-world deployments underscore this shift. Arbitrum and Optimism, L1 DA stalwarts, routinely face fee spikes exceeding $10 per transaction during volatility. Meanwhile, early modular adopters like Dymension on Celestia clock 10,000 and TPS bursts at fractions of a cent. Avail's testnets show similar promise, with rollups posting data via succinct proofs that Ethereum verifies effortlessly.
Head-to-Head: Metrics That Matter for Blockchain Scalability DA
Scalability isn't abstract; it's measurable. Traditional L1 DA rollups cap at 100-500 TPS per chain due to calldata limits, even post-Dencun upgrade. Modular DA layers shatter that: Celestia's 1 GB blocks enable 10,000 TPS aggregate across multiple rollups. Node requirements drop too; full Ethereum nodes guzzle 500 GB and yearly, while DAS light nodes sip kilobytes.
Detailed Scalability Comparison: Traditional L1 DA vs Modular DA Layers
| TPS capacity | cost per MB posted | node storage needs | verification time | security inheritance |
|---|---|---|---|---|
| 15-30 TPS | ~$5-20 / MB | High (2+ TB per full node) | Immediate (<12s) | Full Ethereum L1 security |
| 1,000+ TPS | ~$0.01 / MB | Low (DAS light nodes: <1 GB) | Sub-second (DAS) | Sovereign DA security with sampling |
| ~1,000 TPS (scalable) | ~$0.005 / MB | Low (DAS-enabled) | <1s (sampling) | Sovereign with KZG proofs |
| 5,000+ TPS | ~$0.001 / MB | Medium (restaking operators) | Few seconds | Inherits Ethereum security via restaking |
Cost dynamics favor modularity decisively. Ethereum calldata hovers at $0.50-$5 per MB; Celestia under $0.01. For Ethereum rollups DA, this means sustainable growth for DeFi, gaming, and AI agents. Security holds via Ethereum settlement, but with leaner ops.
Risks and Resilience in Modular DA
Critics point to trust vectors: DA layers introduce new chains, potentially vulnerable to outages or censorship. Celestia's 2024 slashings showed teeth, but L1 DA's centralization via high hardware bars is no picnic. Interoperability bridges add latency, yet standards like IBC and Chain Abstraction smooth this. My take? Modular DA's risks are transitional; Ethereum's proto-danksharding evolves toward full danksharding, but dedicated layers accelerate beyond it.
Hybrid models emerge as winners. Post data on how modular data availability layers enable scalability in 2025 reveal rollups blending L1 blobs for critical data with modular for bulk. This L1 vs modular DA hybrid maximizes Ethereum's security moat while unlocking blockchain scalability DA.
Ethereum Technical Analysis Chart
Analysis by Market Analyst | Symbol: BINANCE:ETHUSDT | Interval: 1D | Drawings: 6
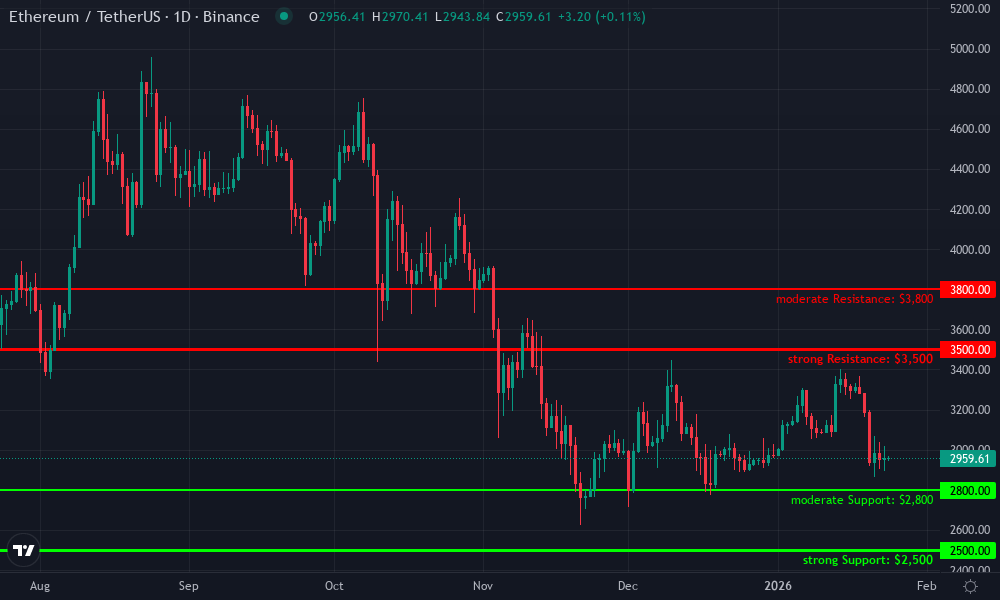
Technical Analysis Summary
To annotate this ETHUSDT daily chart in my balanced technical style, start by drawing a primary downtrend line connecting the November 2026 high around $3,800 to the late February 2026 low near $2,900, using 'trend_line' tool with red color for bearish bias. Add horizontal lines at key support $2,500 (strong, green thick) and resistance $3,500 (strong, red thick). Mark a consolidation rectangle from mid-December 2026 $2,500 to early January 2027 $3,400. Use fib_retracement from October 2026 low $2,800 to November high $3,800 for retracement levels. Place arrow_mark_down at recent MACD bearish crossover in late January 2026, and callout on volume spike during December drop highlighting distribution. Add long_position entry zone at $2,800 with stop_loss below $2,500 and profit_target at $3,500. Use text for labels like 'Bearish divergence' on MACD.
Risk Assessment: medium
Analysis: Bearish momentum but support nearby; DA news positive long-term but technicals dominate short-term
Market Analyst's Recommendation: Hold cash or scale in long at $2,800 support, target $3,500 with tight stops
Key Support & Resistance Levels
📈 Support Levels:
- $2,500 - Major support from Dec low, volume shelf strong
- $2,800 - Recent swing low, fib 50% retrace moderate
📉 Resistance Levels:
- $3,500 - Key resistance from Jan high, prior resistance zone strong
- $3,800 - Nov high, psychological barrier moderate
Trading Zones (medium risk tolerance)
🎯 Entry Zones:
- $2,800 - Bounce from support with volume confirmation, aligned to medium risk medium risk
🚪 Exit Zones:
- $3,500 - Profit target at resistance confluence 💰 profit target
- $2,500 - Stop loss below major support 🛡️ stop loss
Technical Indicators Analysis
📊 Volume Analysis:
Pattern: Increasing on downside, decreasing on upside - bearish divergence
Volume spikes confirm Dec-Jan distribution phase
📈 MACD Analysis:
Signal: Bearish crossover in late Jan
MACD line below signal, histogram contracting negative
Applied TradingView Drawing Utilities
This chart analysis utilizes the following professional drawing tools:
Disclaimer: This technical analysis by Market Analyst is for educational purposes only and should not be considered as financial advice. Trading involves risk, and you should always do your own research before making investment decisions. Past performance does not guarantee future results. The analysis reflects the author's personal methodology and risk tolerance (medium).
Looking ahead, Ethereum's rollup-centric roadmap embraces modularity. L2 competition heats up, with Polygon eyeing Avail, and Near exploring EigenDA. DAS scales to L3s and beyond, powering sovereign rollups untethered from L1 economics. Developers gain flexibility: build execution anywhere, settle on Ethereum, post data modularly.
The pivot reshapes tokenomics too. DA layer tokens like TIA capture value from data posting fees, creating aligned incentives. Ethereum L2s focus on sequencing and apps, unburdened. For builders, this means cheaper, faster dApps; for users, sub-cent txs at scale.
Modular DA doesn't replace L1; it amplifies it. As adoption surges, expect Ethereum throughput to hit millions TPS ecosystem-wide. Dive into how modular DA layers power next-gen scalability to gear up. The scalability crown goes to modularity- Ethereum L2s thrive when data flows free.


No comments yet. Be the first to share your thoughts!